In today’s laboratory environments, the real value of artificial intelligence is not found in isolated features—it lies in the outcome of robust data infrastructure and streamlined workflows. Simply put: AI is not a feature. It is an outcome of great data and workflows. When you build the right foundation, your lab can evolve into a self‑improving, data‑driven engine.

Data Readiness: typed, linked, versioned.
At the heart of the transformation is data readiness. If your lab data remains untyped, siloed, or version‑inconsistent, any downstream AI initiative will struggle. The imperative is clear: data must be typed (meaning each element has a clear defined schema), linked (so relationships between samples, assays, runs, lots and users are explicit), and versioned (so historical context, lineage and changes are traceable). Research in laboratory medicine underscores this principle: predictive analytics depend heavily on accurate and detailed data. Companies building for AI‑in‑the‑lab increasingly emphasize infrastructure, not just algorithms. Without this foundation, you can launch a flashy AI tool—but it will be brittle and risk falling short.
Automation: events trigger jobs, not people.
Once your data is ready, the next pillar is automation. Think of your lab as a live factory: when a run finishes, an event is emitted—automatically triggering downstream jobs such as QC checks, model scoring, report generation. Rather than relying on manual human intervention for each step, the system responds to events. This reduces human toil, reduces latency, and improves consistency. For example: a run completes → validate data; if pass → auto‑train incremental model; if drift → alert and roll back. That implies your data infrastructure must support event‑driven architecture and responsive workflows.
.jpeg)
Observability: lineage, metrics, drift.
Automation and readiness are necessary but not sufficient: you must see your system work. Observability is the third pillar. That means full lineage (which samples fed into which assays, which features were generated, which model used what input), metrics (feature freshness, label lag, model drift, SLA for predictions) and drift monitoring. Only by continuously measuring and understanding your pipelines can you improve them. Observability ensures you don’t just run a system—you manage it and make it resilient.
Introducing the Scispot Blueprint
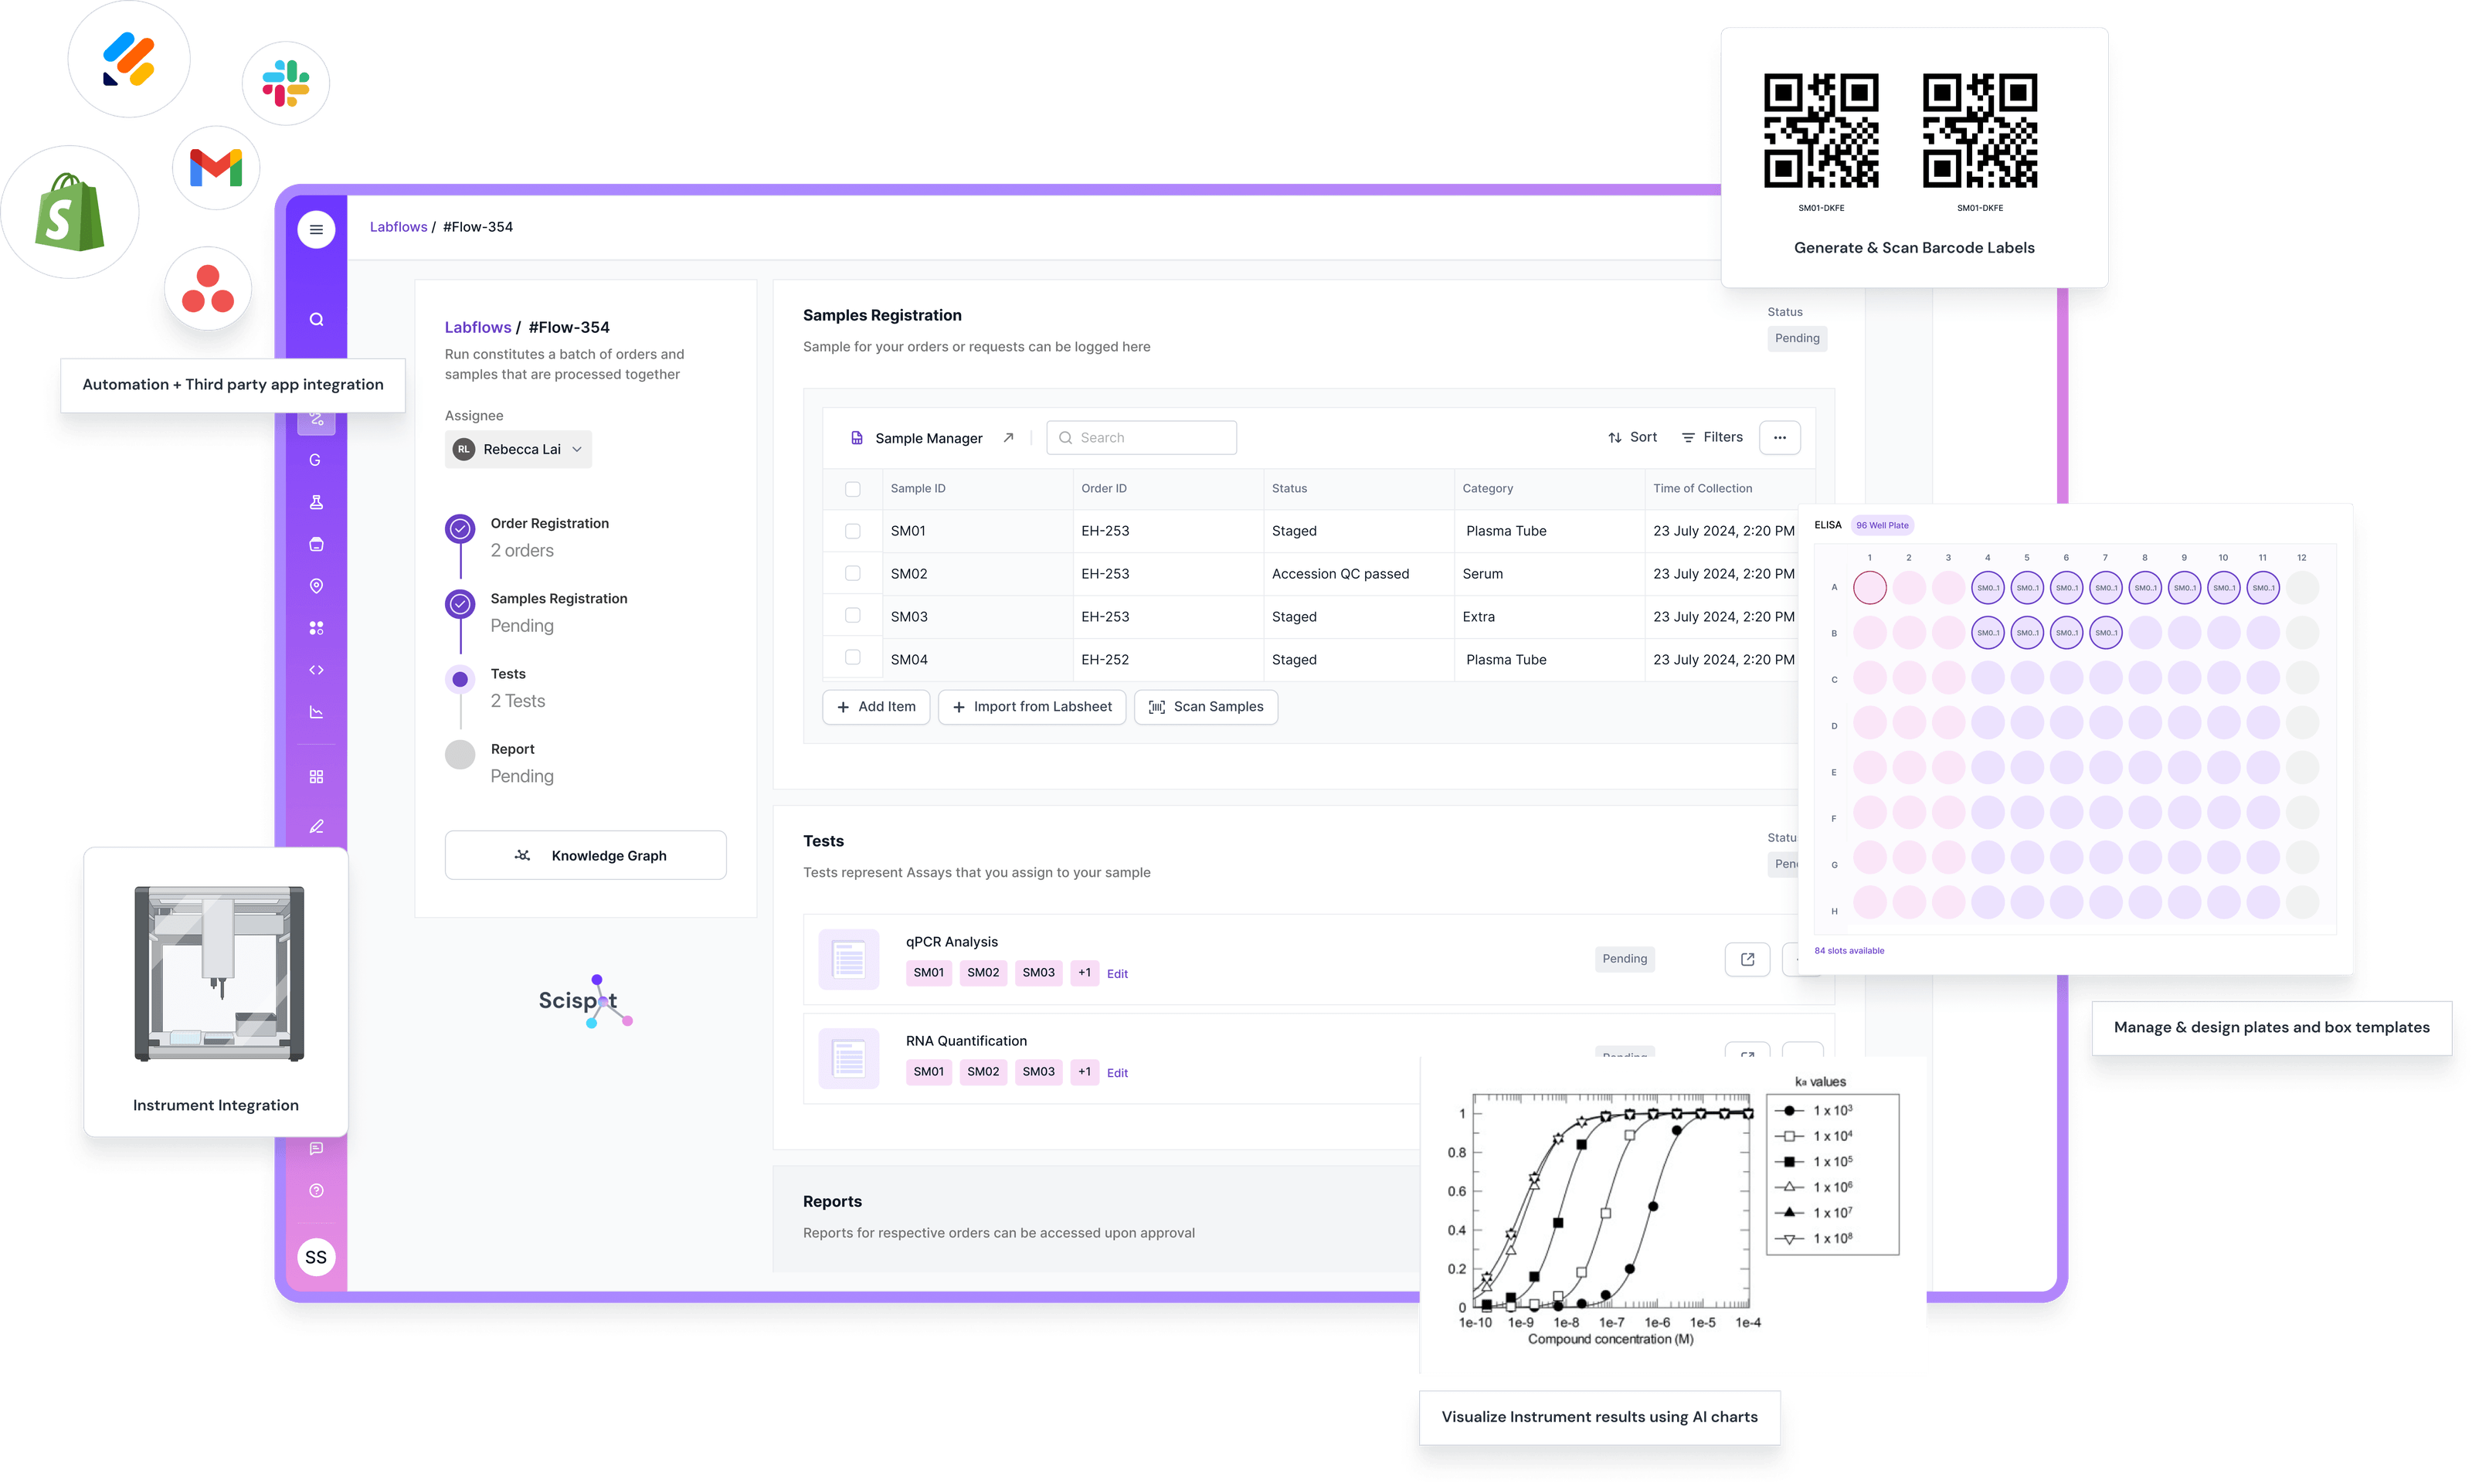
The blueprint for turning this concept into reality can be encapsulated by a lab‑centric architecture:
- Entity graph: Represent samples, assays, runs, lots, and users as nodes in a graph so relationships are explicit and queryable.
- Feature stores: Store stable, curated features for model building so you avoid ad‑hoc feature engineering each time.
- Event bus: Example: run‑finished → QC → model → report workflow. Events flow through the system, jobs respond in real time.
- Feedback loop: Human labels (e.g., QC override, anomaly flag) close the loop and feed back into model retraining and feature improvement.
This blueprint builds a system where AI is not a luxury add‑on—it becomes an integrated outcome of lab operations.
Analogy: Think of AI as a mill. Grain must be cleaned, sorted, and fed at the right speed. The LabOS is the millworks.
Imagine your lab is a grain mill. The grain (raw data) arrives. It must be cleaned (quality control), sorted (typed, linked, versioned), and fed at the right speed into the mill (feature store and model pipeline). The mill (AI) will only work well if the upstream steps are stable. The infrastructure (LabOS) is the millworks—the conveyors, the sorters, the feeders, the controls. Without that, the mill becomes noisy, inefficient, and unpredictable.
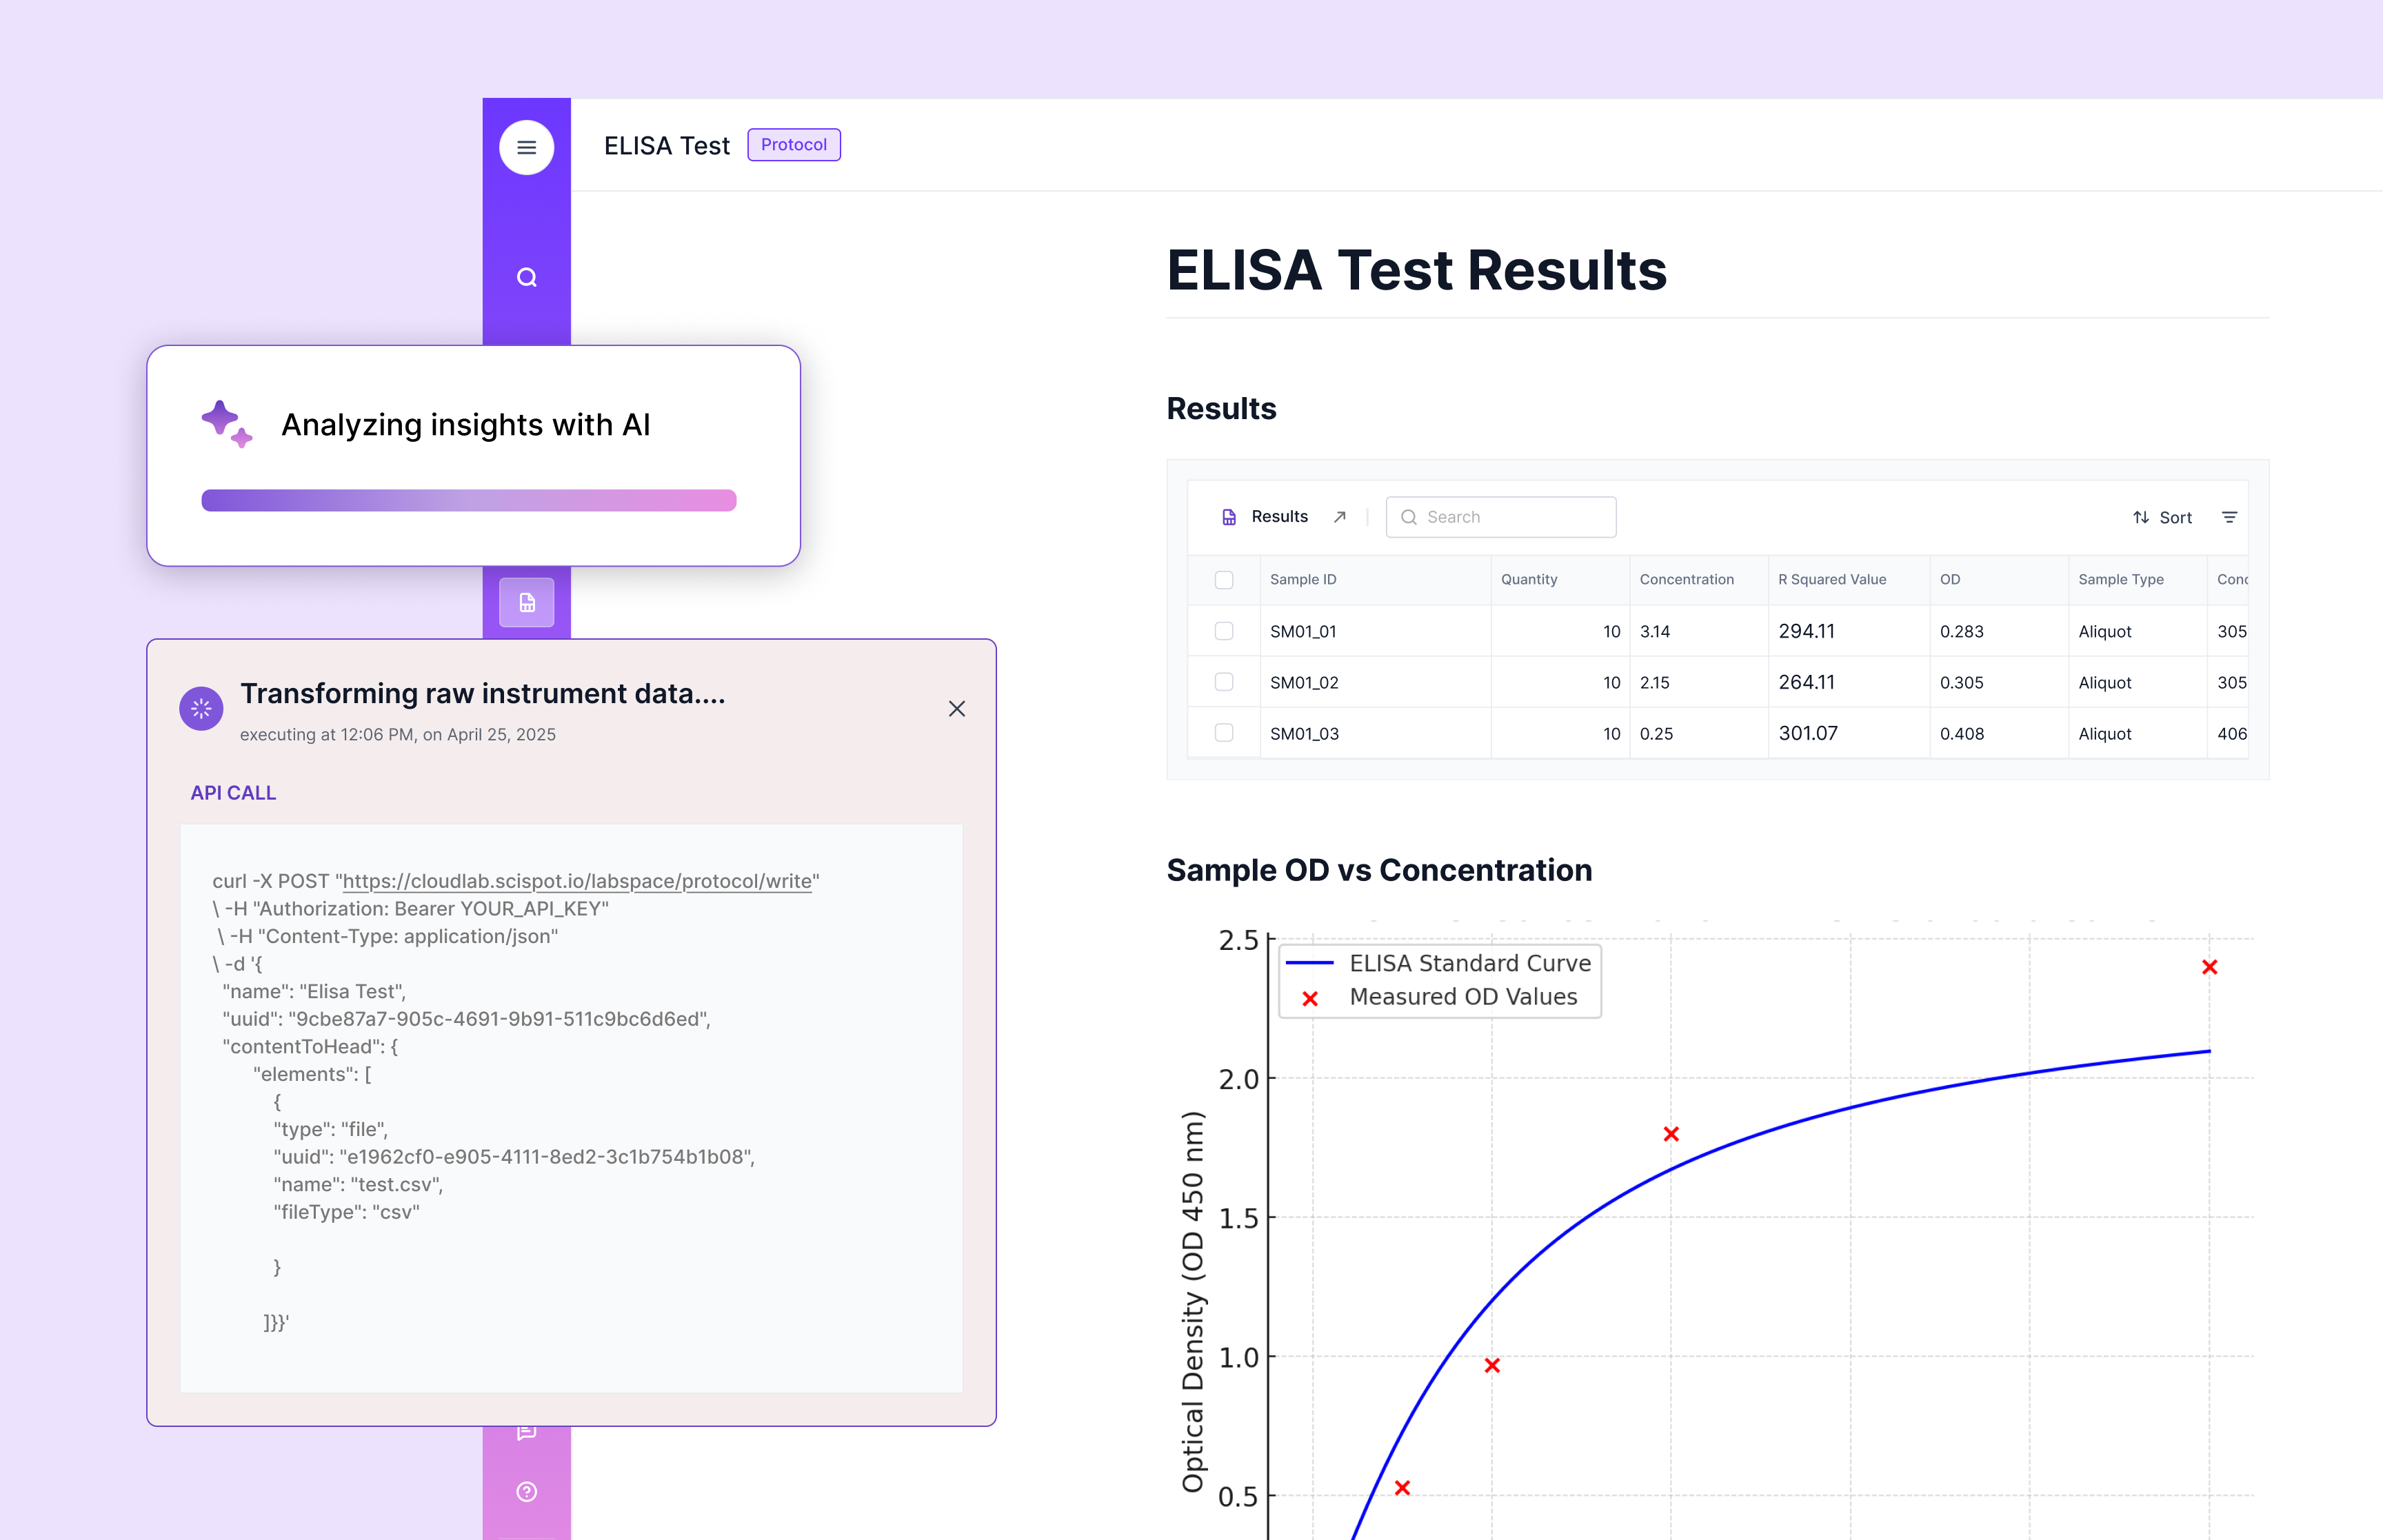
Example triggers
Here are some example triggers that operationalize the concept:
- A run completes → system validates data automatically; if data passes QC, triggers incremental model training; if model drift is detected → alert and roll back to previous version.
- When label lag exceeds threshold → automatically assign human review for a batch of samples.
- When feature freshness drops below SLA → pause model scoring, alert data engineering.
These operational triggers illustrate how readiness + automation + observability combine to create a learning system.
.jpeg)
Metrics that matter
To manage your system you need meaningful metrics. For example: label lag (how long between sample measurement and label capture), feature freshness (time since last update of features used by model), model drift (deviation between expected vs actual performance), SLA for predictions (turnaround time from run finished → insight delivered). These metrics keep you honest and ensure you’re delivering value.
Pros and Cons
There are clear advantages: the system becomes a learning system, you reduce manual toil, and you boost quality of outcomes because the data‑AI cycle is tighter. On the other hand, there are trade‑offs: you need MLOps and data engineering skills, you must invest in governance, auditing, and infrastructure. You must accept that building the pipeline takes upfront effort before the pay‑off.
Key Takeaways
- The power of AI accrues from pipelines, not just models.
- Build events and feedback into your system from day one.
- Observe your system: once you can measure it, you can improve it.
Think of your lab as a mill: infrastructure (LabOS) matters as much as the AI itself. If you approach laboratory data infrastructure with readiness, automation and observability in mind, you position your lab not just for incremental improvement—but for true AI‑powered transformation.
.webp)
.webp)